




- Published on: 2026-09-21 01:19:44
Mastering the Equity Curve: Understanding Drawdown in Trading for 2026

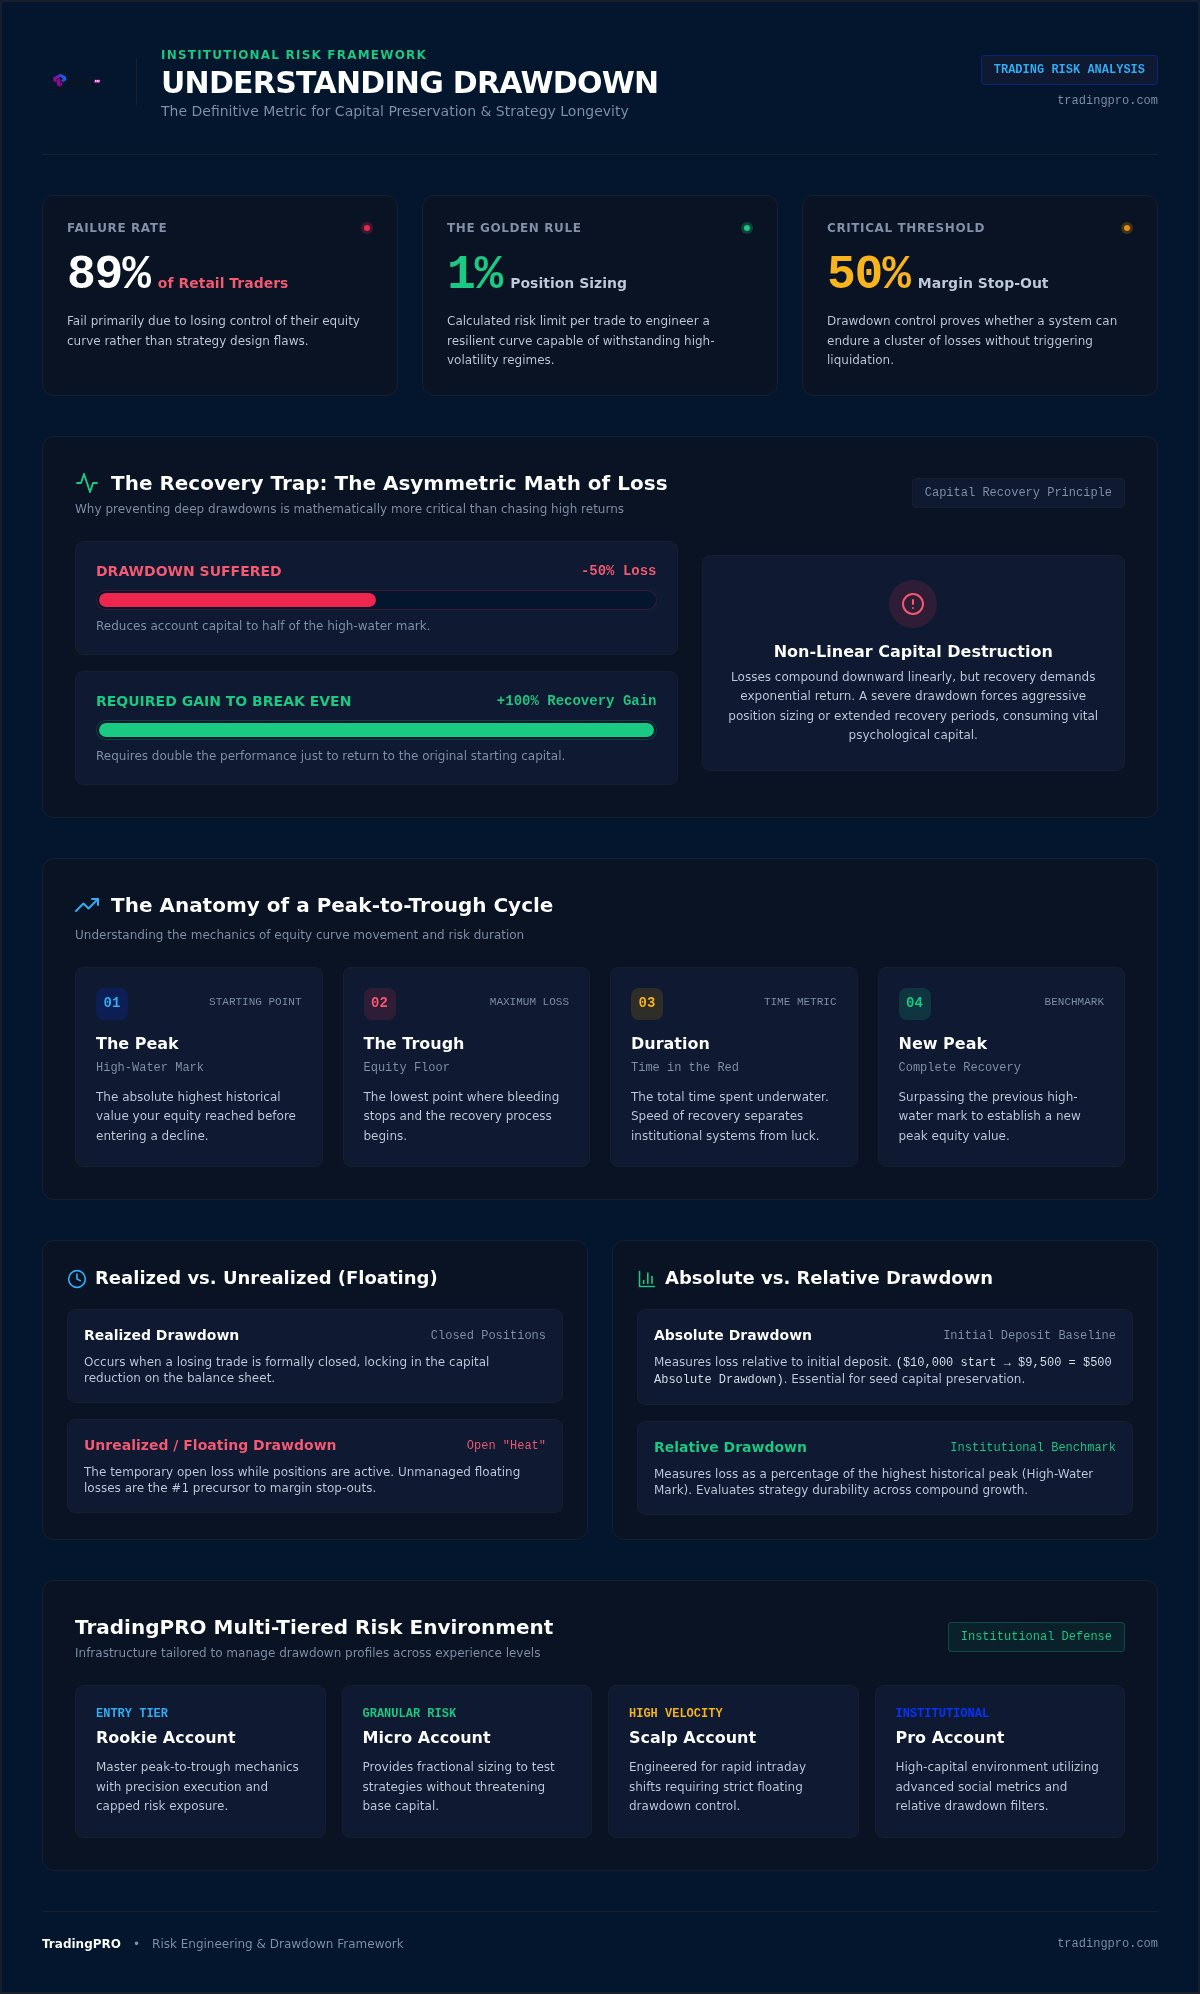
Did you know that up to 89% of retail traders fail because they lose control of their equity curve? It's a staggering reality of the 2026 market. Most participants treat a losing streak as a personal failure rather than a structural variable. Success starts with understanding drawdown in trading as a calculated cost of market participation. You cannot eliminate risk. You must engineer it. This ensures a single bad week never ends your career.
We know the gut-punch of watching your balance slide while wondering if your strategy is broken. It's a brutal mathematical trap where a 50% loss demands a massive 100% recovery gain. We're here to change that trajectory. This guide provides the professional framework to measure, manage, and recover from losses before they become catastrophic. You'll learn to deploy TradingPRO's institutional-grade infrastructure to set hard circuit breakers on your equity. We're moving beyond simple survival. We're building the elite confidence required to scale your performance in any market environment.
Key Takeaways
- Learn why understanding drawdown in trading is the definitive metric for assessing strategy risk and ensuring long-term market survival.
- Uncover the asymmetric math of the "Recovery Trap" to understand why preventing deep losses is more critical than chasing high returns.
- Implement professional position sizing and the 1% Rule to engineer a resilient equity curve that withstands high-volatility regimes.
- Leverage TradingPRO’s multi-tiered accounts and Social Trading metrics to align your risk management with institutional-grade standards.
Mastering the Mechanics: What is Drawdown in Trading?
Trading is not a linear climb to the summit. It is a relentless series of tactical surges and calculated retreats. At its core, understanding drawdown in trading means quantifying the exact distance between your account's highest historical value and its subsequent low point. Think of it as the ultimate stress test for your strategy. While amateurs obsess over win rates, elite performers focus on the depth of the valley they must cross before reaching the next peak. It is the definitive measure of how much capital you are prepared to lose in pursuit of your next win.
Many traders confuse volatility with risk. They are not the same. Volatility measures the speed and intensity of price movement; drawdown measures the actual destruction of your equity. It is a superior metric because it tracks the real-world impact on your wallet. A volatile strategy might swing wildly but stay near its peak. A high-drawdown strategy, however, puts your entire career at risk by eroding your "high-water mark" until your margin is exhausted. Control the valley, and you control the game.
Your equity curve serves as the visual pulse of your trading journey. It is a live map of your performance that reveals the truth your spreadsheet might hide. To master this curve, you must distinguish between realized and unrealized drawdown. Realized drawdown occurs when you close a losing position. Unrealized, or floating drawdown, represents the "heat" your account takes while trades are still open. Professionals never ignore floating losses. They know that an unmanaged unrealized dip is often the precursor to a total account wipeout.
The Anatomy of a Peak-to-Trough Cycle
Every drawdown cycle begins at the "Peak," the absolute highest point your equity reached before a decline. The "Trough" is the floor where the bleeding stops and the recovery begins. The distance between these two points defines your risk profile. However, the most critical variable is often the time spent in the red. Analyzing drawdown duration and peak-to-trough metrics is vital for determining if a strategy is simply experiencing a normal lull or if it is fundamentally broken. Speed of recovery is what separates institutional-grade systems from lucky streaks.
Why Every Professional Trader Tracks Drawdown
Professionalism is defined by how you manage the "red." Drawdown is the primary indicator of strategy durability. It proves whether your system can survive a cluster of losses without triggering a 50% margin stop-out. Beyond the mathematics, drawdown consumes your psychological capital. Deep declines trigger emotional distress, leading to revenge trading and catastrophic errors. Institutional risk desks use these metrics to filter out reckless gamblers. For those refining their approach, starting with a TradingPRO Rookie Account provides the perfect environment to master these mechanics with precision execution and manageable risk.
The Anatomy of Loss: Types of Drawdown Every Pro Must Know
Professional reporting requires more than a single, surface-level number. To truly dominate the markets, you must dissect the specific ways your capital evaporates during a losing streak. Understanding drawdown in trading at an institutional level involves tracking three distinct metrics that reveal the health of your strategy and your psychological resilience. Whether you are managing a high-leverage Scalp Account or a steady Pro Account, these figures dictate your long-term survival. Don't guess your risk. Measure it with precision.
The impact of these metrics scales with your ambition. A minor dip in a Micro Account is a learning opportunity; the same percentage drop in a Pro environment represents a significant capital event. Mastery begins with knowing exactly which type of loss you are facing at any given moment. You can evaluate how elite traders handle these pressures by analyzing the performance metrics available on the TradingPRO Social Trading feed before committing your own capital to a copy strategy.
Absolute vs. Relative Drawdown
Absolute Drawdown is your first line of defense. It measures the loss relative to your initial deposit. If you start with $10,000 and your balance hits $9,500, your absolute drawdown is $500. It's a binary indicator of whether you're currently "in the money" or "out of the hole." For those starting with a Rookie Account, this is the most vital metric for preserving your seed capital.
Relative Drawdown is the institutional benchmark for comparing diverse strategies. It measures the loss as a percentage of the highest equity point your account has ever reached. This is critical because it accounts for the compounding nature of your growth. A 10% drop from a $50,000 peak is far more telling than a $500 absolute loss. Aligning your expectations with FINRA risk management principles ensures you prioritize capital preservation over reckless expansion.
Maximum Drawdown (MDD) and System Failure
Maximum Drawdown (MDD) is the ultimate stress test, representing the single largest peak-to-trough decline in your account's entire history. It is the "worst-case scenario" that has already happened. MDD is the definitive tool for determining if a strategy is simply in a temporary slump or if it is fundamentally broken. If your current decline exceeds your historical MDD, your strategy's edge may have evaporated.
Every professional must define their "Uncle Point." This is the maximum loss you are willing to sustain before shutting down a strategy entirely. It acts as a manual circuit breaker for your career. By setting this limit, you remove emotion from the equation and protect your remaining equity for the next opportunity. Ready to see how the pros manage their curves? You can monitor real-time strategy stats to see drawdown management in action.
The Recovery Trap: Why Drawdown Math is Your Biggest Adversary
Most traders fail because they treat losses as a linear equation. They assume that a 10% loss requires a 10% gain to recover. This is a catastrophic misunderstanding of market mechanics. Understanding drawdown in trading requires confronting the reality of asymmetric risk. When your equity drops, your remaining capital must work significantly harder just to return to the previous peak. This mathematical hurdle is the primary reason why uncontrolled losses lead to account liquidation.
The "Death Spiral" begins when traders attempt to bypass this math through reckless aggression. In a desperate bid to "make it back," they increase leverage or ignore stop losses during a losing streak. This behavior ignores the exponential nature of recovery. By the time an account hits a 50% drawdown, the required return to break even jumps to 100%. This is why Rookie Accounts are essential for those still mastering their edge; they allow for smaller lot sizes that prevent these deep mathematical traps before they become insurmountable.
The Non-Linear Math of Winning Back Capital
The math is unforgiving. As your drawdown deepens, the required gain to reach your previous high-water mark scales at an accelerating rate. Once you cross the 20% threshold, the recovery effort begins to decouple from the initial loss. Capital preservation is not just a defensive tactic; it is the most aggressive growth strategy you have.
| Account Drawdown (%) | Required Gain to Recover (%) |
|---|---|
| 10% | 11.1% |
| 20% | 25.0% |
| 30% | 42.9% |
| 40% | 66.7% |
| 50% | 100.0% |
| 75% | 300.0% |
| 90% | 900.0% |
Psychological Drawdown: The Hidden Cost of Losses
The hardest part of a trough isn't the math; it's the mental toll. "Revenge Trading" is a direct result of failing to accept the recovery curve. When you see your balance drop, the urge to "fix" the mistake immediately can cloud your judgment. This leads to strategy drift, where you abandon a proven system just when it's most likely to perform. Maintaining a "Neutral Mindset" means viewing the trough as a temporary data point rather than a personal failure. Successful pros stay disciplined, knowing that their edge will eventually pull them out of the valley if they don't destroy their capital first.
Engineering Stability: Practical Strategies for Drawdown Management
You've mastered the math; now you must build the fortress. Understanding drawdown in trading is the foundation. Engineering stability is the execution. Start with the 1% Rule. It's the industry gold standard for capital preservation. Never risk more than 1% of your total equity on a single position. This discipline ensures that even a rare 10-trade losing streak results in a manageable 10% dip rather than a catastrophic account failure. It keeps you in the game when the market turns hostile.
Position sizing is your most powerful lever for smoothing the equity curve. Adjust your lot sizes based on current market volatility rather than fixed numbers. When volatility spikes, scale down to keep your dollar risk constant. Diversify across uncorrelated assets to further dampen the impact of sector-specific shocks. Don't just trade FX majors; mix in commodities or indices to ensure a single move doesn't tank your entire portfolio. For those requiring extreme precision to avoid slippage-based losses, the ScalpX account offers the institutional-grade execution needed to protect every pip of your equity.
Advanced Risk Control Techniques
Automation is your greatest ally in 2026. Hard stops are mandatory. Mental stops are a myth used by amateurs to justify staying in losing trades. Use trailing stops to lock in gains while giving the market breathing room to move. Watch out for correlated risk. Being long on EUR/USD and GBP/USD simultaneously isn't diversification; it's doubling your exposure to the same dollar move. Identify these overlaps and cut the correlation to keep your drawdown within professional limits.
Infrastructure as a Defense Mechanism
Execution speed is a vital risk management tool. Slow fills lead to "slippage drawdown," where you lose money before the trade even starts. Elite traders use the TradingPRO Trade Hub for real-time monitoring to spot these leaks instantly. Our infrastructure includes negative balance protection, ensuring extreme market gaps never push your balance into the red. You need a safe haven when the environment turns volatile. Secure your capital and register your account today to deploy these professional defenses.
Institutional-Grade Defense: Managing Drawdown with TradingPRO
Success in 2026 isn't just about finding the right entry; it's about staying in the game when the market tests your resolve. Understanding drawdown in trading provides the map, but TradingPRO provides the vehicle. Our multi-tiered account structure is engineered to match your specific risk tolerance. Whether you're navigating the precision-heavy environment of a Scalp Account or building a foundation in a Pro Account, our infrastructure ensures your equity curve remains within your control. We provide the stability you need to execute with absolute confidence.
Strategic buffers are essential for weathering the inevitable troughs. The Deposit Bonus acts as a vital margin cushion, providing extra breathing room during periods of temporary drawdown. This additional equity isn't just a number on a screen; it's a safety net that helps you maintain your positions without triggering premature margin calls. It allows you to focus on your strategy's long-term performance rather than flinching at every intraday fluctuation. Empower your journey by turning risk management into your greatest competitive advantage.
Evaluating Drawdown in the Social Ecosystem
Copy Trading offers a shortcut to diversification, but only if you know how to audit the Master Traders. Always look past the raw profit percentages. Focus on the Max Drawdown metric on their profiles to see the true cost of their returns. Professionals use the Calmar Ratio, comparing annual returns to the maximum drawdown over the same period. A high return with a massive drawdown is a ticking time bomb. Build a diversified "Copy Portfolio" by selecting traders with uncorrelated strategies to flatten your combined equity curve and minimize systemic risk.
Your Next Steps to Professional Risk Management
The path to elite status is incremental. Start small with a Rookie Account to practice drawdown control in a live environment without overextending your capital. This is your training ground for mastering the asymmetric math we've discussed. Once you've proven your ability to protect your equity, scale up to our institutional-grade infrastructure for best-in-class execution and tighter spreads. Don't leave your capital to chance. Join TradingPRO today and dominate the markets with professional risk tools that put you in the driver's seat of your financial future.
Own Your Equity Curve: The Path to Elite Performance
Mastering your equity curve isn't about avoiding losses; it's about engineering them. You've learned that understanding drawdown in trading is the definitive boundary between a temporary trough and a career-ending spiral. By respecting the non-linear math of recovery and implementing hard risk circuit breakers, you position yourself among the market's elite. Capital preservation is your most aggressive growth tool. It's time to stop fearing the dip and start managing it like a professional.
TradingPRO provides the institutional-grade infrastructure to turn these principles into peak performance. Leverage our negative balance protection across all account tiers to safeguard your capital against extreme market gaps. Utilize our lightning-fast institutional execution speeds to eliminate slippage-based losses. If you're building a diversified portfolio, our comprehensive Social Trading metrics expose the true risk profile of every Master Trader. Don't leave your success to chance.
Start your trading journey with a professional edge at TradingPRO and dominate the 2026 markets with total confidence. Your next peak is within reach.
Frequently Asked Questions
What is a "good" or acceptable drawdown percentage in trading?
An acceptable drawdown typically ranges between 10% and 20% for professional retail strategies. Institutional allocators look for a Calmar Ratio above 2.0, where annual returns significantly outweigh the largest peak-to-trough decline. If your drawdown exceeds 25%, the mathematical effort to recover becomes exponentially harder. Selecting the correct account tier, such as the TradingPRO Pro Account, helps you align these percentages with your specific capital goals and risk tolerance.
How do I calculate maximum drawdown for my own trading account?
To calculate maximum drawdown, identify the highest peak your account equity reached and the lowest point it touched before hitting a new high. Subtract the trough value from the peak value, then divide by the peak value. This gives you the percentage drop. Understanding drawdown in trading is simplified with TradingPRO's automated reporting tools, which track these metrics in real time to help you monitor your strategy's durability.
Can I use copy trading to reduce my overall portfolio drawdown?
You can use Social Trading to reduce portfolio drawdown by diversifying across multiple Master Traders. Choosing traders with uncorrelated strategies ensures that a trough in one system is offset by gains in another. This flattens your overall equity curve. Use our Social Trading metrics to filter for low historical drawdown and consistent recovery periods. Building a diversified "Copy Portfolio" is a sophisticated way to manage risk without needing to monitor every individual trade.
What is the difference between drawdown and a standard loss?
A standard loss is the result of a single closed trade, whereas drawdown is the cumulative decline from your account's peak equity. A single loss only contributes to drawdown if it pulls your balance below its previous high-water mark. Drawdown provides a holistic view of your strategy's risk, measuring the total capital at risk during a losing streak. It's the definitive metric for assessing how much heat your account sustains.
How long should it take to recover from a 20% drawdown?
Recovering from a 20% drawdown requires a 25% gain on your remaining capital. The time this takes depends entirely on your strategy's monthly return profile. If you average 5% monthly, expect a five-month recovery period. Avoid the temptation to increase leverage to speed up this process, as it often leads to deeper losses. Professional discipline and institutional-grade execution speed are your best tools for returning to peak equity as efficiently as possible.
What happens if my drawdown exceeds my account balance?
Your account will typically hit a margin call or stop-out at the 50% equity level to prevent total depletion. In the event of extreme market gaps where drawdown could theoretically exceed your balance, TradingPRO provides negative balance protection across all tiers. This institutional safeguard ensures you never owe more than your initial deposit. It creates a "safe-haven" environment, allowing you to trade high-stakes markets without the risk of personal debt.
Does leverage increase the risk of drawdown?
Leverage significantly increases the risk of deep drawdown by amplifying the impact of every price movement against your equity. While it empowers larger positions, it simultaneously narrows your margin buffer. Understanding drawdown in trading requires a balanced approach to leverage. Beginners should consider starting with a Rookie Account to practice position sizing with lower risk. High leverage should be reserved for those with proven strategies and the infrastructure to manage rapid equity swings.
Should I stop trading during a drawdown period?
Don't stop trading unless your current drawdown exceeds your historical Maximum Drawdown. If the loss is within your strategy's expected parameters, stopping will cause you to miss the recovery phase. However, if you hit your "Uncle Point," pause to re-evaluate. Use TradingPRO's Trade Hub to analyze your performance data. Determine if your strategy is fundamentally broken or if you simply need to adjust your position sizing for current market volatility.


