




- Published on: 2026-09-30 12:15:05
Market Depth for Trading: A Practical 2026 Guide

A thick wall of buy orders can look like a green light, but it isn’t a promise that price will rise. Displayed liquidity can shift or disappear quickly, and the book you see may cover only part of the activity across a market. If order-book ladders feel technical and hard to trust, that’s a valid concern. Using market depth for trading decisions takes more than spotting the biggest number on screen. It means reading bids and asks in context, checking how depth changes, and not treating a displayed order as certainty.
This guide offers a practical process for interpreting depth levels and comparing them with price action and other market signals. It explains what standard Level 2 views may leave out, why data can differ by venue or provider, and when a fast-moving or incomplete book isn’t a sound basis for action. The goal is a disciplined read, not a prediction. Use market depth as one input in a repeatable decision process, assess it alongside broader signals, and follow your own risk limits.
Key Takeaways
- Read bids, asks, and visible order-book levels to understand displayed liquidity, not guaranteed buying or selling interest.
- When using market depth for trading decisions, treat order-book imbalance as context rather than proof of where price will move.
- Compare depth with price action, volume, and time and sales, while keeping each signal’s limits in view.
- Before acting, confirm the instrument, venue, timestamp, and whether the data is real-time or delayed. Then check the market context, define risk, and reassess.
- Assess a trading setup against your experience, instruments, platform needs, and risk tolerance. Verify data access rather than assuming it’s included.
What market depth shows, and what it cannot tell you about a trade
Market depth displays visible buy and sell limit orders waiting at different prices. It shows where participants have placed orders and how much quantity is displayed at each level. A price chart records how price has moved; market depth shows some of the queued orders around the current market. For a neutral overview of the concept and factors that can influence it, see market depth.
Think of depth as a snapshot, not a promise. Orders can be added, changed, cancelled, or filled, sometimes before you can respond. A large displayed quantity doesn’t guarantee it will remain available, that your order will execute, or that price will move in the direction it appears to suggest. That distinction is central to using market depth for trading decisions.
How to read bids, asks, and price levels
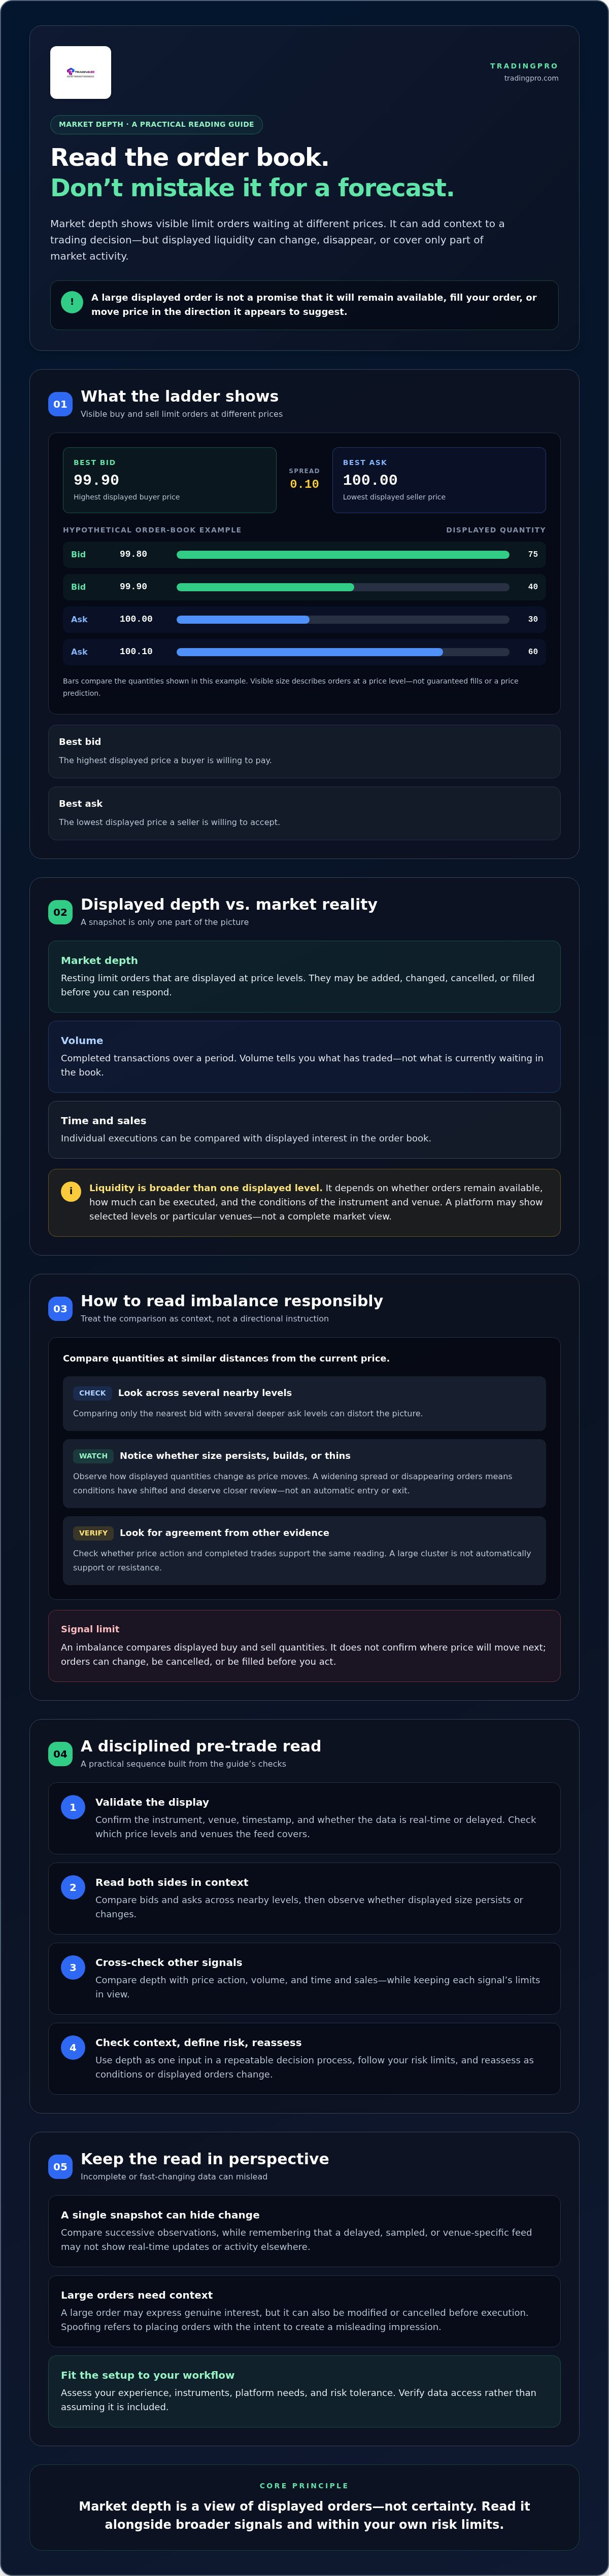
The best bid is the highest displayed price a buyer is willing to pay; the best ask is the lowest displayed price a seller is willing to accept. The gap between them is the spread. Beyond those top prices, the depth ladder shows additional bids below and asks above, often with the quantity displayed at each price.
Hypothetical order-book example:
- Bid: 99.90, quantity 40
- Bid: 99.80, quantity 75
- Ask: 100.00, quantity 30
- Ask: 100.10, quantity 60
Here, 99.90 is the best bid and 100.00 the best ask, so the spread is 0.10. The figures show visible quantities at those levels, not guaranteed fills or a forecast. More displayed quantity may indicate potential liquidity at a price, but only if it remains there when an order reaches the market.
Market depth versus liquidity and market volume
Depth displays resting orders that may be available to trade. Volume records completed transactions over a period. It tells you what has traded, not what is currently waiting. Time and sales can show individual executions, while the order book shows displayed interest that could change before execution.
Liquidity is broader than the size shown at one level. It also depends on whether orders remain available, how much can be executed, and the conditions of the instrument and venue. A deep-looking ladder can thin quickly, while a limited display doesn’t necessarily represent all available interest. Coverage varies: a platform may show selected price levels or data from particular venues rather than a complete view of the market. Check what the feed includes before relying on it. Use depth as context to test against other evidence, not as a standalone signal.
How to interpret market depth without treating the order book as a forecast
A lopsided order book can catch your eye, but visible size on one side doesn’t confirm what price will do next. An imbalance is a comparison of displayed buy and sell quantities. To make it useful, compare bids and asks at similar distances from the current price. Comparing only the nearest bid with several deeper ask levels can distort the picture.
Depth reflects displayed orders, not guaranteed future buying or selling. A large cluster at one price may indicate interest there, but it isn’t automatically support or resistance. Orders can be changed, cancelled, or filled before you act. Use an imbalance as a prompt to investigate, not as a directional instruction. The practical overview of how market depth is used can add context, but your interpretation still needs to account for the data in front of you.
Reading imbalance and liquidity near the current price
Compare visible quantities across several nearby levels on both sides. Then watch whether those quantities persist, build, or thin as price changes. A widening spread or disappearing orders may signal that conditions have shifted and warrant a closer review. Neither change is an automatic reason to enter or exit. Check whether price action and completed trades support the same reading.
Spotting misleading signals and incomplete data
One snapshot can hide how quickly the book is changing. Compare successive observations, but remember that a delayed, sampled, or venue-specific feed may not show updates in real time or represent activity elsewhere. Verify which market and venue the display covers, which levels it includes, and when it was last updated. Without that context, a dramatic imbalance can give a misleading impression.
Large orders can be legitimate expressions of interest, yet they may also be modified or cancelled before execution. Spoofing refers to placing orders with the intent to create a misleading impression of supply or demand before cancelling them. Don’t assume every large order is deceptive; a single display can’t establish intent. Look for repeated changes and compare them with executed trades, while recognising that the data may not reveal the full picture.
In practice, using market depth for trading decisions means testing what the display suggests against other evidence, then deciding whether the signal is reliable enough to consider. If you’re exploring a trading environment, you can review account registration and assess your options against your experience and needs. Verify available market-depth data for the specific instrument, account, and platform rather than assuming it’s included.
Market depth versus price action, volume, and time and sales
Each market signal answers a different question. Depth shows visible orders waiting to trade; price action tracks changes in traded prices; volume totals completed trading over a chosen period; and time and sales lists reported executions where that data is available. These signals can complement one another, but they aren’t interchangeable. An order still waiting in the book is evidence of displayed interest, not evidence that a transaction has happened.
What each market signal contributes
Use this comparison to keep the evidence distinct. Coverage, timing, and detail can vary by instrument, venue, and data provider, so check what your platform actually displays.
| Signal | Data represented | Key limitation |
|---|---|---|
| Market depth | Visible resting orders at displayed price levels | Orders can change or disappear; the view may not cover every venue or level |
| Price action | Movement in traded prices over time | Doesn’t show all orders available to trade |
| Volume | Quantity traded during a period | Summarises completed activity, not current queued interest |
| Time and sales | Reported individual executions, often with price and quantity | Detail depends on data availability and may not show the full market |
Combining signals while keeping risk in view
Look for context and confirmation, not a perfect match. In a hypothetical example, the book shows heavier bids near the current price, price rises, and time and sales reports executions at progressively higher prices. Those observations may support a reading of active buying, but they still don’t establish what happens next. If the bid size vanishes while price stalls and executions occur at lower prices, the signals conflict. Pause and reassess rather than forcing a bullish or bearish interpretation.
When using market depth for trading decisions, consider what each signal confirms and what remains unknown. Check the instrument, venue, and timestamps, then set your risk limits independently of the apparent size on the screen. The display can change before an order is placed, and no combination of signals removes uncertainty.
For information about TradingPRO’s platform tools, visit the TradingPRO Trade Hub. Confirm directly whether its current tools provide the specific market data and coverage you need. Don’t assume a particular depth display or feed is available.
A five-step process for using market depth before placing a trade
Turn the order book into a disciplined pre-trade check, not a reason to rush. This workflow keeps data quality, broader price context, and risk in view before you act.
From market context to a testable trade idea
Start with the instrument and its recent price behaviour. Then inspect the depth ladder. Record the spread and nearby quantities as observations, not predictions. Ask what else would support your idea, such as price holding a level or reported trades confirming activity. Decide in advance what would weaken or invalidate the idea.
- 1. Confirm the data. Check the instrument, venue, timestamp, and whether the feed is real-time or delayed. Verify which price levels and market activity the display covers. If the information is stale or unclear, don’t treat it as a reliable basis for action.
- 2. Check the context. Review the broader price movement and current trading conditions before focusing on individual orders. Note the spread and nearby depth. A ladder is useful only when you know which market it represents.
- 3. Compare signals. Test the depth observation against price action, volume, and reported executions if available. Agreement can add context, not certainty. If signals conflict, pause and reassess rather than forcing a trade idea.
- 4. Define risk. Before entering, set the conditions that invalidate the idea, determine acceptable exposure and position size, and decide where a stop or other exit will sit. Base those choices on your plan and tolerance, not on displayed order size.
- 5. Reassess. Check whether the original evidence still holds as the market changes. If the data becomes incomplete, the spread shifts, or the idea’s conditions fail, follow your plan rather than relying on an order that may have disappeared.
Set risk limits before using order-book signals
A displayed bid or ask can change before your order reaches the market. It can’t protect a position, guarantee a fill, or replace a planned stop. Keep your invalidation point and exit conditions clear, and size positions so that the potential loss fits your limits. For more on risk management and trading basics, consult a beginner forex guide and adapt the principles to the instrument you trade.
Using market depth for trading decisions works best as a repeatable check within a broader plan. If you’re ready to explore a trading environment, review registration options as an optional next step. Confirm data availability for the specific instrument, account, and platform before relying on depth tools.
Choose a trading setup that fits your market-depth workflow
Market depth is one input, and its value depends on what the data covers and how it fits the instrument and trading context. Before choosing an account, work backwards from your process: what do you trade, what information do you need, and how will you use it alongside price action, executions, and a risk plan? Using market depth for trading decisions doesn’t require the most complex setup. It requires data you understand and a workflow you can apply consistently.
Questions to ask before choosing a trading account
Check the practical details before registering. Confirm which instruments are available for the account you’re considering and whether the platform provides the market data you need. Don’t assume Level 2 or another depth display is included. Verify availability for the specific instrument, account, and platform, and check whether the data is real-time or delayed and which venues it represents.
- Experience: Does the account fit your familiarity with trading and the tools you can interpret?
- Instruments: Can you access the markets you intend to trade, and is depth data available for those instruments?
- Platform needs: Does the platform support your planned workflow? Verify specific features rather than inferring them from an account name.
- Terms and location: Review applicable account terms, the relevant regional entity, and platform details before you register.
- Risk tolerance: Can you follow your position-sizing and exit plan even when displayed orders change?
Choose for fit, not for promised outcomes. A setup that matches your experience and intended workflow is more useful than one selected because it sounds advanced.
A measured next step with TradingPRO
TradingPRO offers Rookie, Micro, Pro, and Scalp accounts. These are account tiers, not confirmation of particular market-depth tools or data access. Compare the available options with your experience and requirements, then verify relevant instrument access, data availability, platform details, and terms before deciding.
If you’d like to explore those options, review registration and account options at your own pace. Trading involves risk, and market depth cannot eliminate it or guarantee a trading outcome. Treat the order book as decision context, and keep your risk limits in control.
Make depth part of a disciplined trading plan
Market depth adds a view of displayed orders, but its value depends on data coverage, timing, and market context. Use it alongside price action, volume, and reported executions, then follow a repeatable process: verify the data, test your idea, define risk, and reassess as conditions change. That’s the foundation of using market depth for trading decisions without mistaking the order book for a forecast.
The right trading setup should fit your experience, intended instruments, platform needs, and risk tolerance. TradingPRO offers Rookie, Micro, Pro, and Scalp account tiers, along with Social Trading and Copy Trading. Check the relevant account terms and confirm the data and platform features available to you before making a choice. Trading involves risk, and no account type or market signal can remove it.
Ready to explore your options? Review your account options and register with TradingPRO at your own pace. Build your process step by step, stay selective with the signals you trust, and keep your decisions anchored to a clear plan.
Frequently Asked Questions
What is market depth in trading?
Market depth is a view of visible buy and sell limit orders waiting at different price levels. The order book typically shows bids, asks, and the quantities displayed at each level, forming a ladder around the current market price. It shows potential liquidity, not completed trades or guaranteed orders. Coverage can vary by instrument, venue, platform, and data provider, so check what the display includes.
How do you use market depth to make trading decisions?
Use market depth as one part of a wider decision process, not as an automatic entry signal. Confirm the instrument, venue, timestamp, and whether the feed is real-time or delayed. Compare visible orders with price action, volume, or reported executions, then define your position size, invalidation point, and exit conditions. Using market depth for trading decisions means testing an observation against other evidence and reassessing if conditions change.
Does market depth predict whether a price will rise or fall?
No. Market depth doesn’t reliably predict future price direction. A larger quantity of visible bids than asks shows an imbalance in displayed orders at that moment, but those orders can be changed, cancelled, or filled. Treat the imbalance as context to investigate, not proof of buying pressure or an impending rise. Compare it with executed trades and price movement, and keep your risk plan independent of the order book.
What is the difference between market depth and volume?
Market depth shows visible orders waiting to trade at specified prices. Volume records completed transactions over a selected period. In short, depth describes displayed potential interest, while volume describes activity that has already occurred. The two can tell different stories: a large order may appear in the book without being filled, while high volume confirms trades took place but doesn’t show all orders still waiting.
Can market depth be misleading?
Yes. The display may be delayed, limited to certain price levels, or drawn from only one venue or data source. Visible orders can also change or disappear before execution. Some orders may be placed to create a misleading impression of supply or demand, but a large order alone doesn’t prove deceptive intent. Check data coverage and timing, observe changes, and compare the book with price action and completed trades.
Is market depth useful for forex trading?
It can provide context, but its usefulness depends on the forex instrument and the data source. Forex trading is decentralised, so a depth display may represent liquidity available through a particular venue or provider rather than a complete market-wide order book. Check which prices and orders the feed covers and whether it’s current. Don’t assume one provider’s view represents all forex trading activity or predicts where a currency pair will move.
What is the difference between Level II data and market depth?
The terms are often used interchangeably, but the amount of information shown can differ. A Level II display commonly presents several bid and ask price levels, while a full depth-of-book product may show more orders across the book. The exact coverage depends on the market, venue, and data product. Check how many levels are included and whether the display covers one venue or a broader set of orders.


